AP Course Participation by Race/Ethnicity
Report Description
This report shows AP Course Participation as either numbers or percentages by Race/Ethnicity and Gender.
Additional Information
See Page Help for Details.
View Selector Help
Selector Name
Selector Screenshot/Description
View
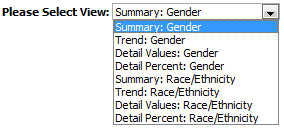
Click to change between a bar graph (Summary), line graph (Trend), and tabular format (Detail) to view the data. Each is available based on specific Race/Ethnicity and Gender.
Gender

Click to update the graph with content from a specific Gender.
Year
![]()
Move the slider left and right to update the graph with content from that specific year.
Report Links Help
Link
Purpose
Click to Print the report.
Export
Click to Export the report into a local file in PDF, Excel, Powerpoint, Web Archive, or Raw Data (CSV, Tab Delimited, XML) format.